

Today, I want to discuss how an editor or content creator can use some really basic web analytics to improve the performance of their products and deliver higher return-on-investment for their efforts.
The chart above is a pretty typical example of a "long tail" graph. I made up the numbers above, but let’s consider that it represents articles by a single editor for a B2B media brand. So, what we are looking at is the performance of 37 articles based on page views, over a given time frame.
And that is well and good. When you consider things like this over a longer time frame – say, a year – with a mix of new and archived content, the long tail makes a lot of sense. But what about when you measure it differently, including:
- Only new content.
- A focused (eg: short) time frame.
- Content from a single channel/topic/author.
So, for the above example, let’s consider that this person wrote those 37 articles in a 1 month time period, and their page view data was measured for the same time frame.
Suddenly, things are not all that well and good. Here’s why:
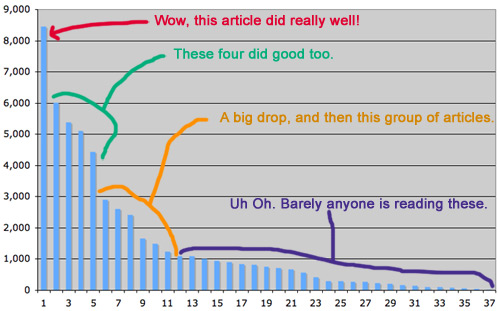
Now, page views are just one way to measure article performance, and a chart like this begs a lot of questions. But, it is clear that for whatever reason, most of that editor’s efforts are not garnering much interest among their intended audience.
When you see those articles on the bottom right, you have to ask yourself: Why bother? Who is this serving? Was this critical content that my audience really needed?
You won’t find the answers in the chart – that will take further research. But this is why I love looking at data on editorial content:
Not because data inherently answers any questions, but because it asks just the right questions.
A chart like the one above should not lead to direct actions, but should raise some red flags about rethinking how that editor spends their time, and how the editorial strategy of that brand is shaped. It also raises significant questions about the needs of that market – what exactly are people desperately searching for? And of course the third thing to consider here is whether it is indeed superb content, but not well marketed or presented, so it gets lost in the shuffle.
Across magazines, newspapers and other media outlets, you keep hearing about staffs shrinking – fewer people to shoulder the load. So they have to be focusing their efforts on JUST THE RIGHT THINGS.
One thing that is empowering online content creators is the incredible wealth of data on their audience’s preferences and habits. Whether you look at web analytics, research data, industry trends, usability testing, or direct feedback through mechanisms like social media – it is easier than ever to find out what people want and how they behave.
Charts like the one above should not be used as a negative judgment – but as a useful tool, helping to ensure a media brand is helping their audience by providing highly useful content and services.
Digging Deeper
One thing I have been spending time on recently is digging. Peeling away the layers of the onion – to go from huge web metrics about an entire brand, to focusing in on specific web metrics that a single editor can affect.
For someone sitting in a gray cube, knowing that their brand’s website traffic is down 3% doesn’t give them any direction. But, knowing which of their 20 articles did great, and which tanked – that puts things in context. And there are so many ways to slice and dice the data.
Here is just a small example of the many long tails that happen within a single brand’s web content, within a single month. For every editor, for every topic, for every channel – you have a variety of long tails:
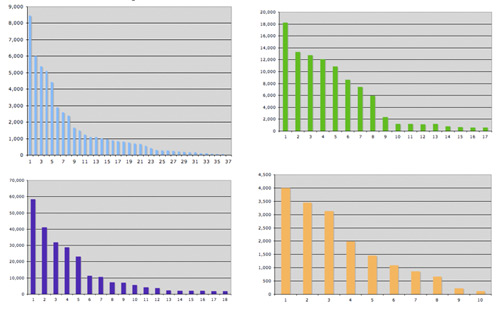
Maybe each of these are metrics for four different authors. Or maybe for four different content topics. Either way, each asks compelling questions about what is working and what isn’t, and where the ROI is the highest.
These charts may also make you consider how you are packaging and marketing this content. Is there something in the system that needs to be tweaked?
Clearly, there are their other ways to measure the value of a piece of content besides page views. But that said, you have to start somewhere!
The Forest for the Trees
If someone only write articles, it there is a chance that they may not realize the full value of other products (such as events, webcasts, blogs, white papers, training courses, ebooks, newsletters, etc.) to both their brand’s revenue streams and to their audience. When considering ROI and where to put scant resources, editorial teams need to consider ALL their products.
One way I have been exploring this is through an audience and revenue report geared towards editors. Here is a sample report with fake data:
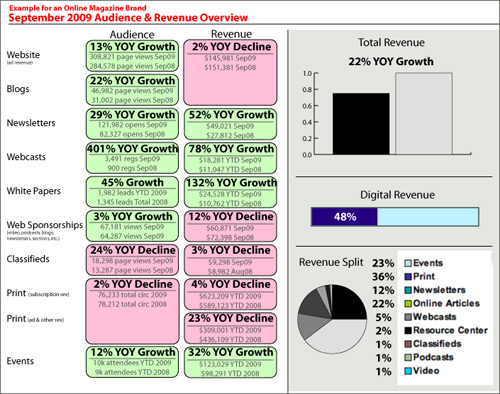
A report like this can be modified in a number of ways to suit different needs. But I think it would be eye opening for many journalists & editors to see something like this – details on what products are driving revenue & audience growth, and which are on the upswing, or are declining.
The question one should ask is: am I focusing on the right things?
There are so many ways you can segment and combine data to make it useful. You can view it by product type, or audience segment, or age, or author, or marketing channel, or content type (reviews vs commentary vs blogs vs news vs features) ,etc. You can (and should) combine data, and then combine it with traditional research metrics. Likewise, you can segment by core visitors vs search referrers, or time of day, or any number of measures.
When you begin looking at data, it’s not long before you begin asking some interesting questions, such as:
- How many of your visitors would you describe as core members of your community – those who come back again and again, and are highly engaged in your content? How are they behaving on your site, and what are their needs?
- How much traffic was search engine "accidents." Articles that performed well, but a large segment of visitors stayed for mere seconds on an article, finding that its content was clearly not what they were looking for?
It’s impossible to tell where journalism & media will be 12 months or 12 years from now. But if the solutions are elusive, it is not for lack of data.
Very, very informative post. I am on the sales and marketing side of our B2B portfolio and consistently review/measure our digital product performance. Our VP of Content is a brilliant guy who is always looking for ways to teach his editors the importance looking at readership data. I certainly plan on forwarding him your post.
Keep up the excellent work.
Jeff,
Thanks so much for the reply, let me know if there is any way I can be of assistance.
Have a nice evening.
-Dan
Really interesting article!
Great post, Dan. I've been pushing for this kind of analysis at my job, too, and just forwarded the link to several colleagues. Thanks for making the case so clearly!
Guy – Thanks. I have another post or two coming up about this same topic. Have a nice evening.
-Dan