
I have been pouring over metrics for some brands here at Reed Business Information, and keep seeing a similar trend. Check out this graph which shows the page views for new articles that one brand uploaded to their site in a given month:
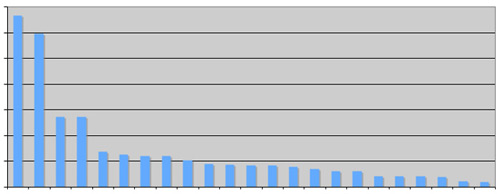
Sure, you see the Long Tail here – a few articles getting a lot of traffic, and then a disbursement down to low trafficked articles. Two ideas strike me when I look closely at the actual data (which I can’t share publicly in an email like this):
- There is an opportunity to push the articles on the left side dramatically further. This is the best content for a given brand, and it is often wildly underexploited. So much opportunity here to increase engagement & page views, and help out your industry even more.
- The value of the articles to the right is in question: Do we continue to put effort here in the future?
I realize that no matter what a brand does, they will still get a Long Tail chart – there will always be articles that receive a lot of traffic, and always some that receive much less. Luckily, we have quite a few tools to help us understand what our readers love, and what we can be doing to make them love us even more.
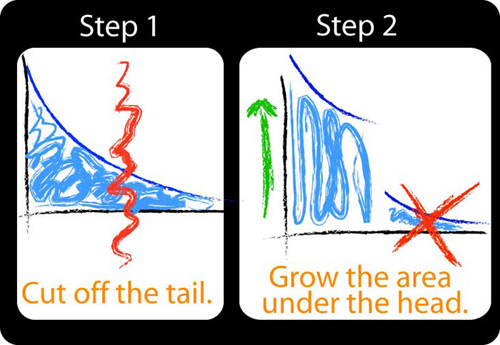
In terms of NEW content that a brand is creating, I propose the following:
This is not a new concept, but I think it speaks to a few realities that magazines and publishers are facing:
- Scarce Resources
The return on investment of every minute of your time is incredibly valuable. It should only go to the most important things – and we can’t know what that is unless we are constantly measuring performance. - Pursuit of High Quality Content
I was chatting with an editor this week who gave me a great quote:"There is no room for mediocrity in a bad economy."
There are many reasons that this is true, but especially when thinking about the needs of your industry at this moment. Many people’s jobs are in question – their business is in question – their industry is in question. They need things that speak to their critical needs, things that will save their job, save their business, and ensure their family is secure. Everything else is useless.
- Can We Please Have Some Fun
Sure, the sky may be falling, but that doesn’t mean we can’t play, dance, smile, hug, and discover new things about ourselves. Times of great need are also times of incredible opportunity.Your industry needs you. This is the moment when heroes are made. Be that person. In my personal opinion, heroes are not made by repurposing press releases. We need to push further.
To illustrate this point, I want to take a look at another example of things that Library Journal is trying out. I have shared two previous case studies on how they are trying to expand their best content: their October 2008 Salary Survey and their November 2008 e-Reference Ratings article.
LJ recently launched their February feature, America’s Star Libraries.
This is the first year that Library Journal has done the Star Libraries article, so we don’t have an apples to apples benchmark – but comparing it to the other recent features is eye opening. A bit of history:
- October Salary Survey: 1200% year over year increase in page views
- November e-Reference Ratings: 730% year over year increase in page views
How did the Star Libraries article do? Let’s see that on a chart:
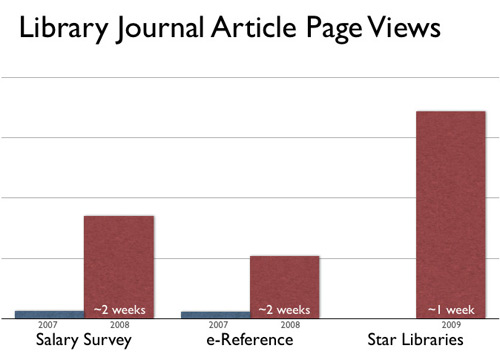
What is most heartening about this traffic is that we are seeing a high level of engagement: a low bounce rate and high average viewing time for these pages. Let’s take a closer look at which sections got the highest percentage of page views:
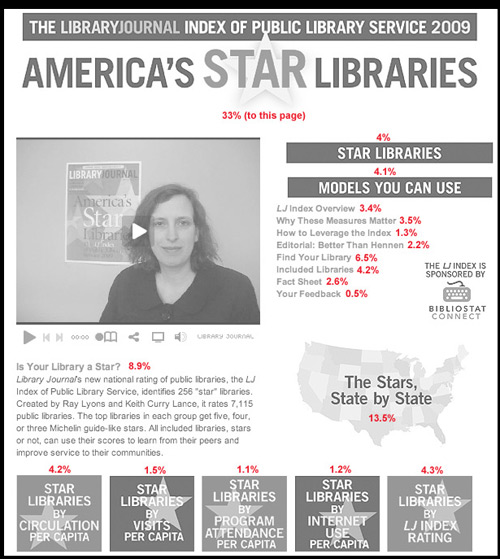
Lots to learn here. There were some surprises for me, and that is exactly why I love looking at metrics – to be surprised – to discover where our gut feeling didn’t pan out. That is incredibly valuable information for next time.
And of course, I love seeing how this article spreads. Here’s a list of some others who have mentioned the Star Libraries story:
- Librarian.net
- Chicago Daily Herald
- Columbus Local News
- Naperville Sun
- Press-Register
- Charlotte Observer
- TradingMarkets.com
- The Oregonian
- East Hampton Press
- Shelter Island Reporter
- Ann Arbor News
- Highlands Ranch Herald
- Cimarron City Library
- Bryant Library
So I want to talk about a few strategies to drive more traffic and further engage readers with content that helps their careers and business:
- Expand the Window

When you look at how a typical article performs online, you once again see that long tail graph. Big spike on day one and two, then it very quickly drops off to tiny numbers after merely a week.
If you expand the time window that this article is new, relevant and helpful, it gives you more opportunities to grow readership. In the past, some brands would work hard to create an article, then kick it out of the nest. Beyond a mention in the next email newsletter, it was often onto the next thing. To me, that is missing the opportunity to learn about the brand’s audience, and leverage their interest to capture more of their attention.
So with Library Journal, we are talking a lot about expanding this window – how we should roll out the content, how to break it up, which sections to promote in which newsletters and when – and how can they follow up with related articles or feedback in a week or two or three. Perhaps it can be leveraged in the blogs, or maybe there are lessons or profiles that can be launched three weeks after the original article goes out.
The first goal is to create content of the highest quality; the second goal is to keep it alive.
And this is just the start. You can later push this content as "best of" features, follow-ups, or even connecting a series of primers on a certain topic.
- Create More Bumps

So, once you expand the time-window, the goal is not to just increase traffic proportionally, but to create more bumps in traffic. You want to get rid of the long tail graph – and replace it with a spiky one.
The key here is to match the ideas above (creating more articles, leveraging feedback channels, etc) with a marketing strategy. What will appear on the homepage, and when – how can we maximize newsletter exposure – can we be working with external bloggers, or thinking more about Twitter?
In a similar vein, I look at web metrics for a lot of bloggers, and I typically see two trends. One: someone who gets lucky once a month – they have one great blog entry or the brand they write for promotes it well in a newsletter, or it gets Dugg, etc. So, their chart has one big spike – a short-lived moment of glory that is difficult to recreate.
The other type of blogger I see is one who tries to get a spike a week. Often, this is based more on strategy, and less on luck. They are constantly measuring what their readers like, and playing with the nuances of what they write and how the promote it.
- Target More Channels

Serendipity might not be a solid business strategy, but I find the more you expose something to more channels, the greater likelihood of serendipity happening. Here are some places to further expose an article:
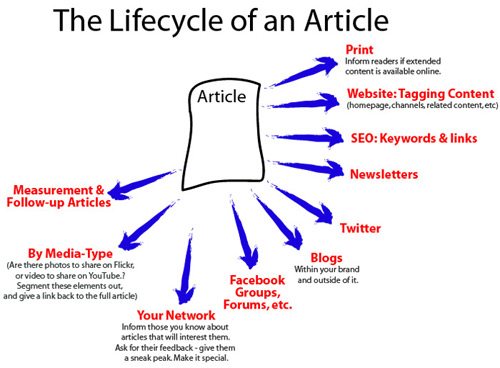
Obviously, a lot of these are nothing new, but doing each properly, measuring results, and finding ways to eek out the most benefit from each channel is critical.
- Create Frankenstein Content

Make content come alive – so take it takes on a life of its own. Use web analytics to create benchmarks, see what is working and focus on the topics that should be covered more, and those that should be covered less. Be selective.
Fresh content alone will not make a reader smile – it has to be incredibly valuable content. This is the stuff they will bookmark, comment on, send to a friend, and mention over lunch.
When analyzing web metrics, look beyond just page views to engagement metrics such as bounce rate or time spent.
Make no mistake – this is a TON of work. But then, even the boring stuff that produces few results is often a ton of work too. One way to make this entire process easier is simple: between each step, eat one munchkin and take one sip of coffee.
As usual: thanks SO MUCH to the staff at Library Journal (The Amercia’s Best Libraries team: Rebecca Miller, Francine Fialkoff, Josh Hadro, Kevin Henegan, Mike Rogers, and so many others!) and everyone else I have chatted with about this topic.